TCPdump commands and parameter

Today we will cover tcpdump tool. Tcpdump is a packet analyzer tool just like wireshark.
It run under command line interface. It help you to capture data packets on low level to understand what is going on inside the packet.
You can run tcpdump on linux/unix based operating systems.

Syntax for tcpdump
tcpdump <paramter>

e.g tcpdump -i eth0

Basic parameter of tcpdump
-i : Specify the network interface to listen on
-c : Number of packets which needs to be captured.
-w : Write the captured packets to a file for later analysis
-r : Read packets from a file instead of capturing from a network interface
-n: Do not resolve hostnames, display IP addresses only
-X: Display both hexadecimal and ASCII representations of packet data
-v: Increase verbosity level
-e: Print the link-level header on each dump line
-q: Quiet output, print less information

Operators in tcpdump:
– and ,&& —–This is used to concatenate two parameter
– or, ||         —–This is or operator used to match any one of the mentioned parameter
– not, !        —–This negate the mentioned parameter
– < – >          —-Less than ,greater then parameter

Let’s take some example
Lets capture packets for eth0 interface for count of 4 packet in default mode.
I will now use any parameter
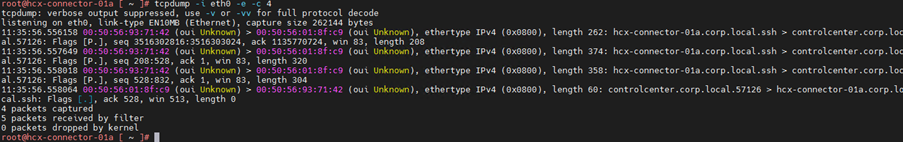
1. tcpdump -i eth0

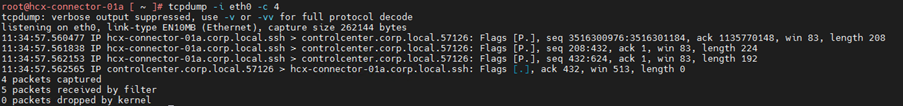
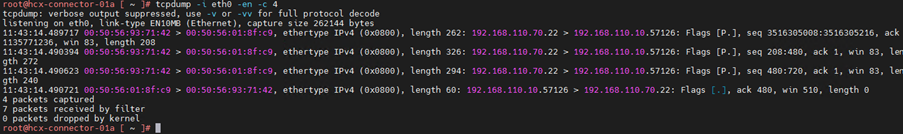
You can see we don’t have any header details here, lets add switch -e parameter to display link layer header.

Now you can see the header details, mac address and ether type. Let’s add parameter -n this will show the host name as ip address in out packet capture.

Now we see the source and destination as ip address instead of hostname. To get more details about the header we can add -v parameter

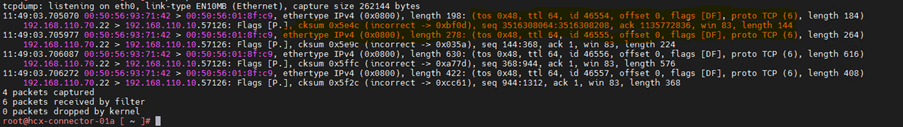
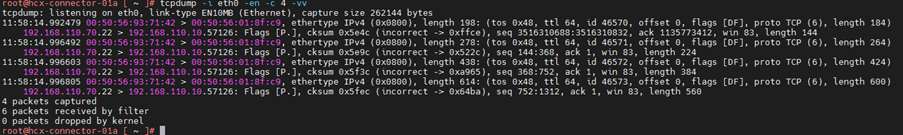
If you want to see more details about the header, then keep adding more verbose -v parameter.

Now I want to write these packet details into file, so that I can read later or I can open in wireshark. Let’s use -w parameter to write file of tcpdump packet. I will save these files with name test.pcap

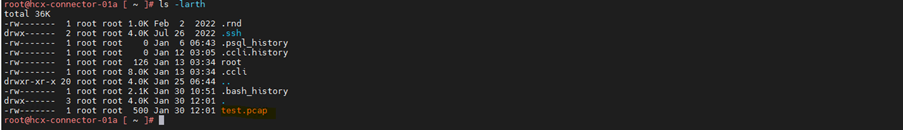
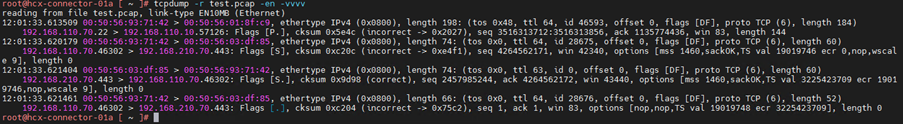
Read this file test.pcap by using -r parameter.

By default, read parameter do not show all packet header details. Use verbose parameter and other parameter to see details.

Few examples for different combination

1.Capture using mac address filter.

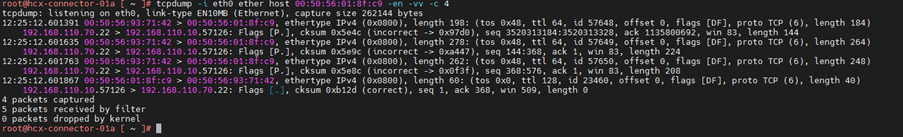
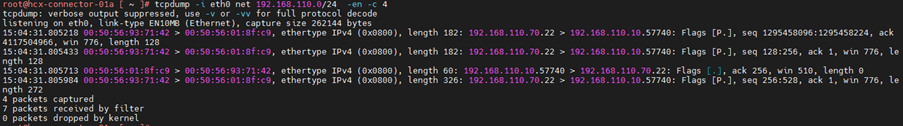
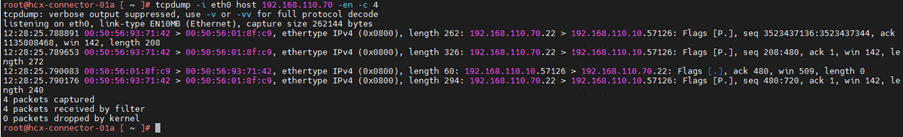
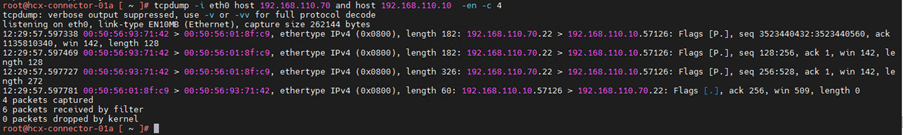
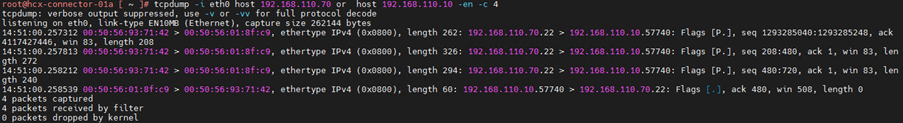
2.Capture all packet with ip address 192.168.110.70

3.Capture packet with ip address 192.168.110.70 & 192.168.110.70. Here anyone can be source or destination.

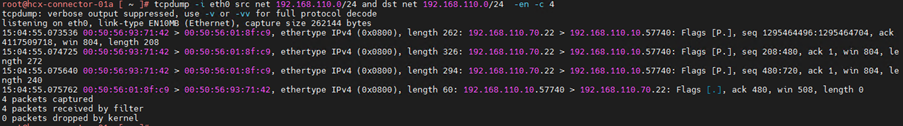
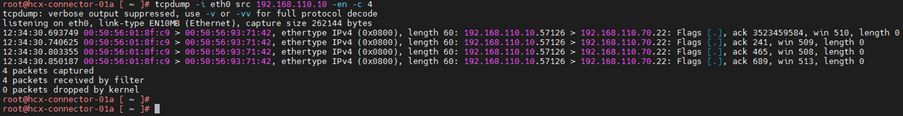
4.Capture packet with source ip address

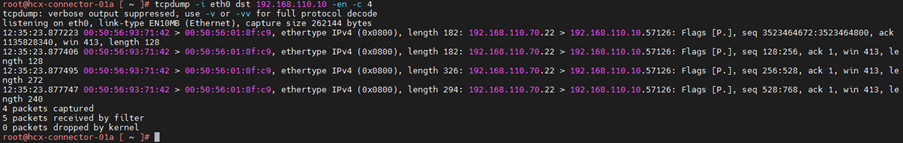
5.Capture packet with destination ip address

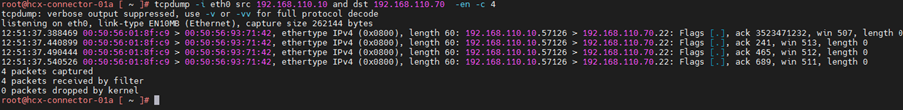
6.Capture packet of source and destination IP address

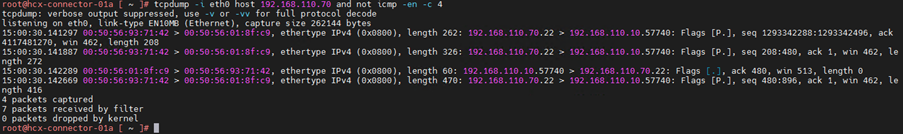
7.Capture packet by ports

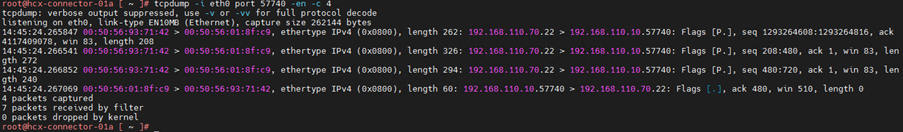
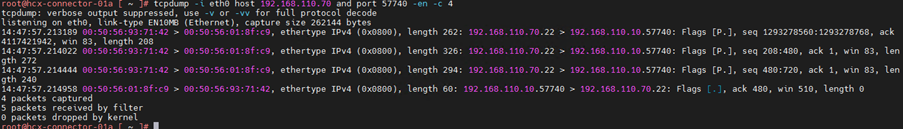
8.Capture packet on ip and ports

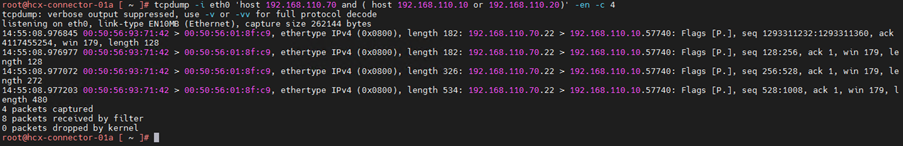
9.Capture using or operator or combination of or and operator

10.Capture using protocol address

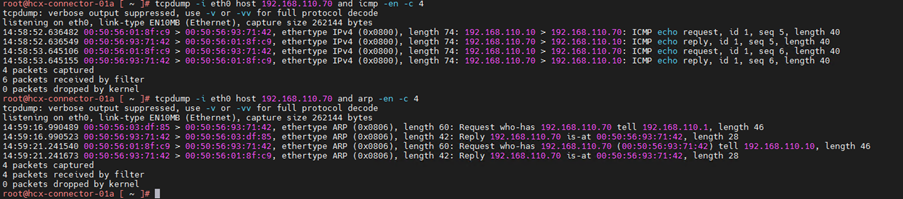
11.Using not operator to filter traffic

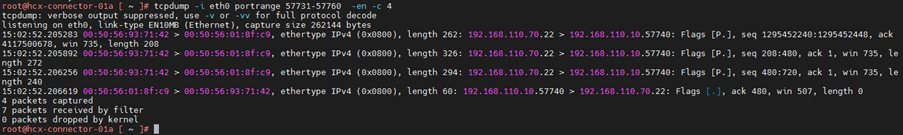
12.Capture the packets for range of ports

13.Capture packets of specific networks

ESXI command lists

1.Nic, Drivers, Stats,vmk,port_num related commands

2.Swtich related commands

3.NIC, vmk, up,down,lacp related commands

4.Module related commands

5.NSX firewall related commands

6.ESX routing related commands

7.VDR,vDL2 related commands

1.Nic, Drivers, Stats,vmk,port_num related commands

esxcli network nic list

Check the physical vmnic associated with the host. This will show all the vmnic physical adapter and its state.It will show the Admin and link status.

esxcli network nic get -n vmnic<vmnic_number>

This command will show you more details about physical vmnic adapter , like fireware version, driver, negotiation details etc.

esxcli network nic stats get -n <vmnic_number>

Now lets say customer have issue in his environment or there is intermittent packet drop on host level or any issue with host specific or vmnic. In that case you can run this command and see the active counter for drop in receive/transmit packet.

net-stats -l

Get the port number of particular VM , this portNum can be used to take packet capture on VM port or to get VM portNum stats.The command can be used with grep to find the portNum of specific VM.

esxcli network port stats get -p <port_number of particular VM>

Use the PortNum of of the VM to check the stats of VM Ports.Run this

NSX-T Upgrade step by Step

NSX-T upgrade from 3.2.1 to 3.2.2

Today we will perform NSX-T upgrade and its operation.

  1. Overview
  2. Upgrade coordinator
  3. Precheck
  4. Upgrade edge
  5. Upgrade host
  6. Upgrade management/controller
  7. Post check
  8. Rollback
  9. Log review in case of any issue.
  10. Summary
  1. Overview

NSX-T upgrade process depends on the number of components you have in your infrastructure. Before proceeding the upgrade you must check the upgrade path and interop matrix with respect to your NSX-T upgrade. Check if the component in your infrastructure is compatible with the new NSX-T version or not.

https://interopmatrix.vmware.com/Interoperability

The upgrade path will show if the upgrade of NSX-T is support from your current version to the target version or not. In our case the target version is 3.2.1.1

https://interopmatrix.vmware.com/Upgrade

Check the known issue and resolved issue for this version of NSX-T in release notes.You will find these details on VMware release notes.

Continue reading “NSX-T Upgrade step by Step”

HTTP Archive(HAR) File

HAR stands for http archive. This is a file format used to capture network/API information between browsers and web/application server.

This is also used for identifying performance issues such as slow load times and page  rendering problems etc.

The HAR file information is stored in JSON format which means in order to visualize the details we need some tool which have view the Jason file inside HAR. We say such tools as HAR viewer.

Steps to proceed with HAR file.

1.Capture the HAR file details in browsers

2.Save the HAR file

3.Analyze HAR file

Continue reading “HTTP Archive(HAR) File”